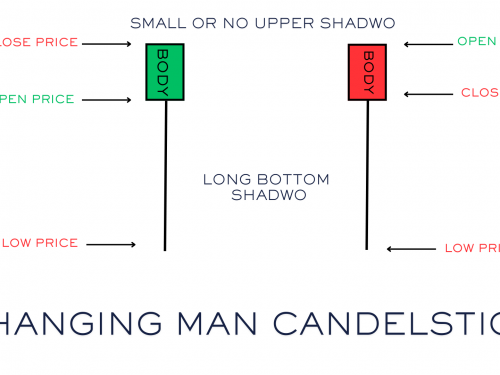
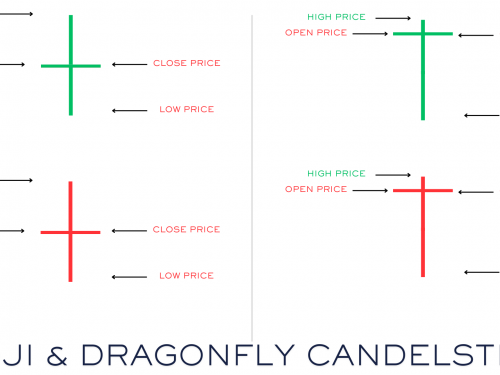
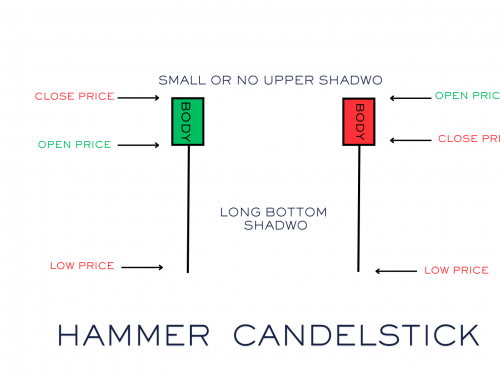
Hanging Man Candle looks similar to hammer Candle. In hanging man candles, opening, closing, and high price are almost the same. Hanging Man Candle has 75-85% lower shadow and 25-15% real body. The hanging man candle is characterized by having a small real body, little or no upper shadow (wick), and a lower shadow at least twice the length of the body.
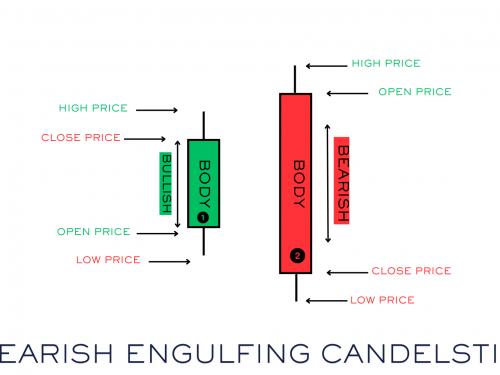
The bearish engulfing pattern is a strong bearish reversal candlestick pattern for intraday in an uptrend market near the resistance zone or supply zone. We can follow a bearish engulfing pattern like a shooting star candle.
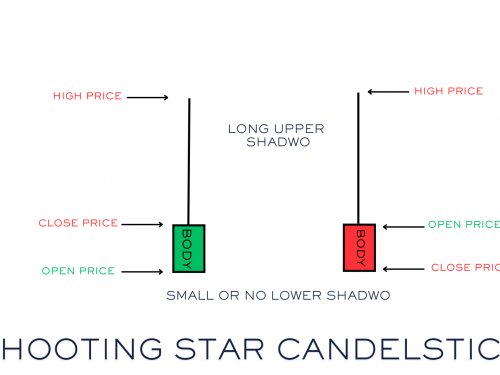
The shooting star candle is the opposite of the hammer candle, which is a bearish reversal candle. Whenever the market is in a state of going up and keeps going up, goes above any supply zone or resistance zone forms a shooting star candle, and starts coming down from the top, then we call it a shooting star candle.
When the candle starts, Buyers want to buy the stock & price move up, but Seller start selling on the stock, due to which the stock does not go up. In the same way, the Seller want to bring down the price of the stock, but the buyers start buying, and the stock is unable to go down. In this way, buying and selling starts happening equally,
When the candle starts, Buyers want to buy the stock & price moves up, but Sellers start selling on the stock, due to which the stock does not go up.
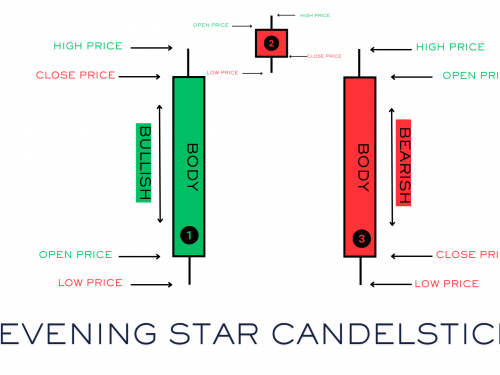
Evening Star candle is a combination of 3 candles 1st is a Green candle 2nd is a Doji candle red or green and 3rd candle should be a red candle. When the market is in an uptrend, the Evening Star candle is formed at the top level near the resistance zone or supply zone, and from there signal bearish reversal When an Evening Sta
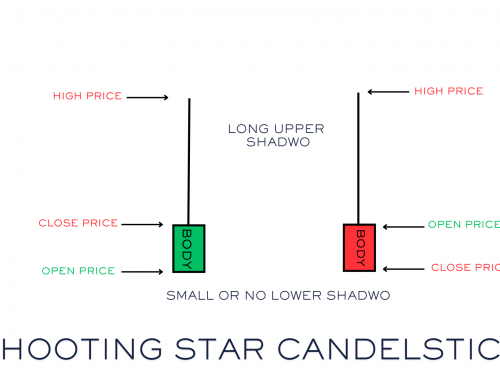
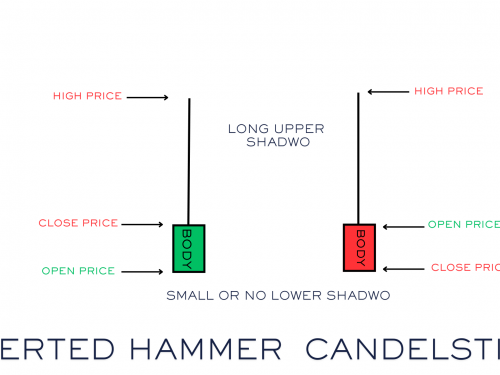
A shooting star candlestick pattern is bearish reversal candlestick pattern. Which is specific type of candlestick formation that appears on trading charts. It looks like an inverted hammer candle, with a small body candle and a long upper shadow, but no lower shadow.
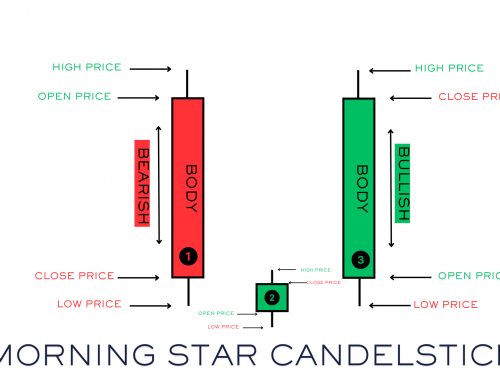
The morning Star candle is a combination of 3 candles 1st is a Red candle 2nd is a Doji candle red or green and 3rd candle should be a green candle. When the market is in a downtrend, the Morning Star candle is formed at the lower level near the support zone or demand zone, and from there signals a bullish reversal.
An inverted hammer candle is a single candlestick pattern. it has a small body, and the upper wick size is at least twice the wick size of the body. This candlestick has no lower wick.
The Hammer candle pattern is a single candlestick pattern with a small body, and the lower wick size is at least twice the size of the body and this candlestick pattern has no upper wick.
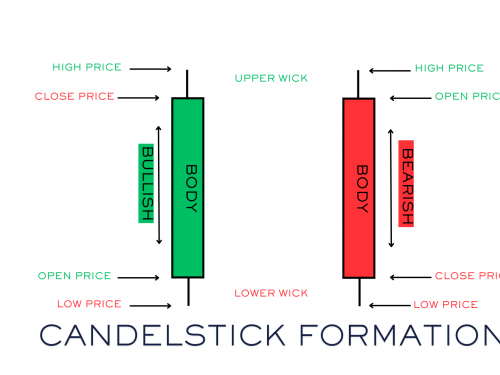
Japanese Candlestick was first introduced by Japan, since then this candlestick pattern has been in use, and the most used chart in the stock market is Japanese Candlestick.

