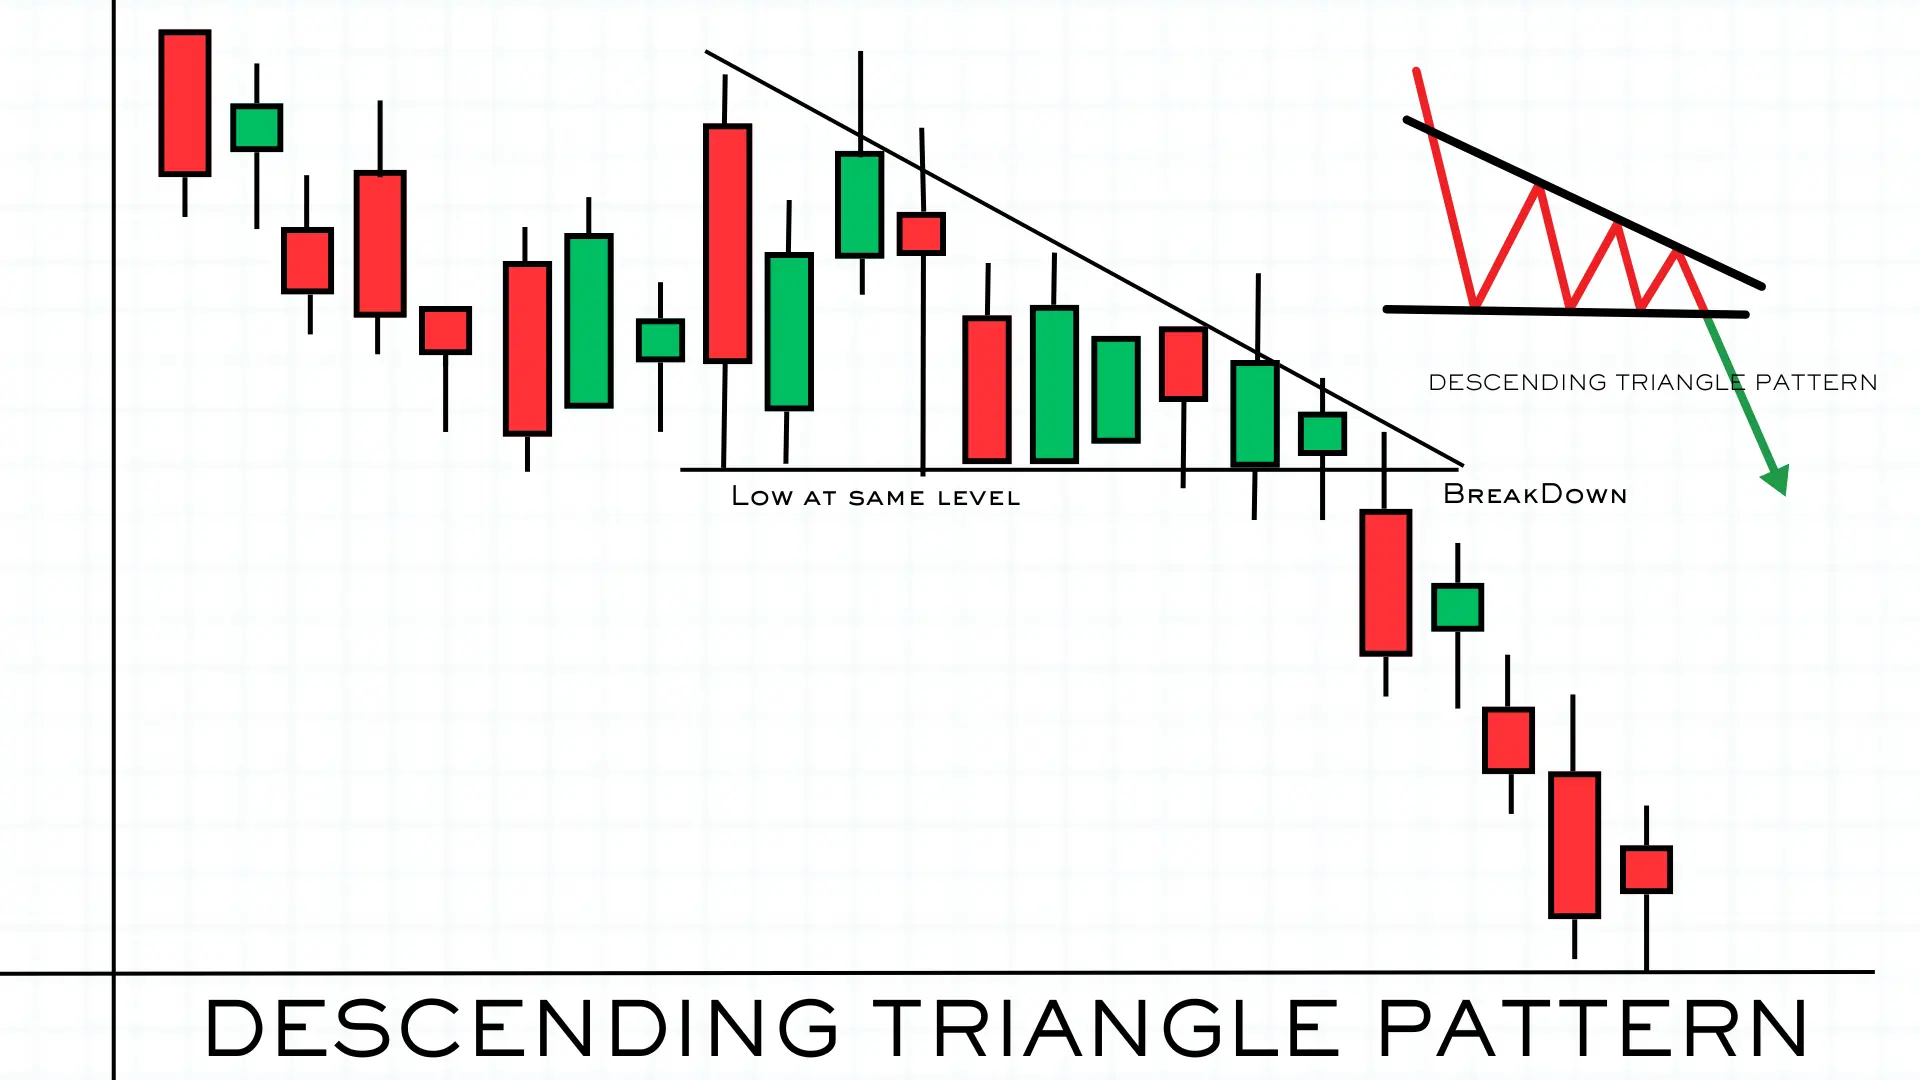
The descending triangle pattern is a bearish chart pattern. It is the opposite of the ascending triangle pattern. In this, the swing lows are at or about the same level whereas there are consistently lower highs. It forms when sellers are getting stronger and buyers are weak. You can take advantage of price fall when the swing lows are broken. You can see the image of the descending triangle pattern for a better understanding.
- Buyers are trying to hold the price up at the support level.
- Sellers are getting more aggressive, pushing the highs lower each time.
How to trade with the Descending Triangle pattern?
For Bearish Traders:
- Wait for the price to break below the support line.
- Place a sell order just below this breakdown point.
- Set your stop loss just above the breakout point.
- Target a price move about the same as the height of the triangle pattern.
For Bullish Traders:
- Sometimes, prices can break out upwards.
- If this happens, you could place a buy order above the resistance level.
- Set your stop loss just below the breakdown
- Target a price move about the same as the height of the triangle pattern.
- Just be extra careful, as this is against the main market trend.
Click here for a Demat Account Opening in Zerodha (Investing and mutual fund free, F&O Per order Rs 20)


