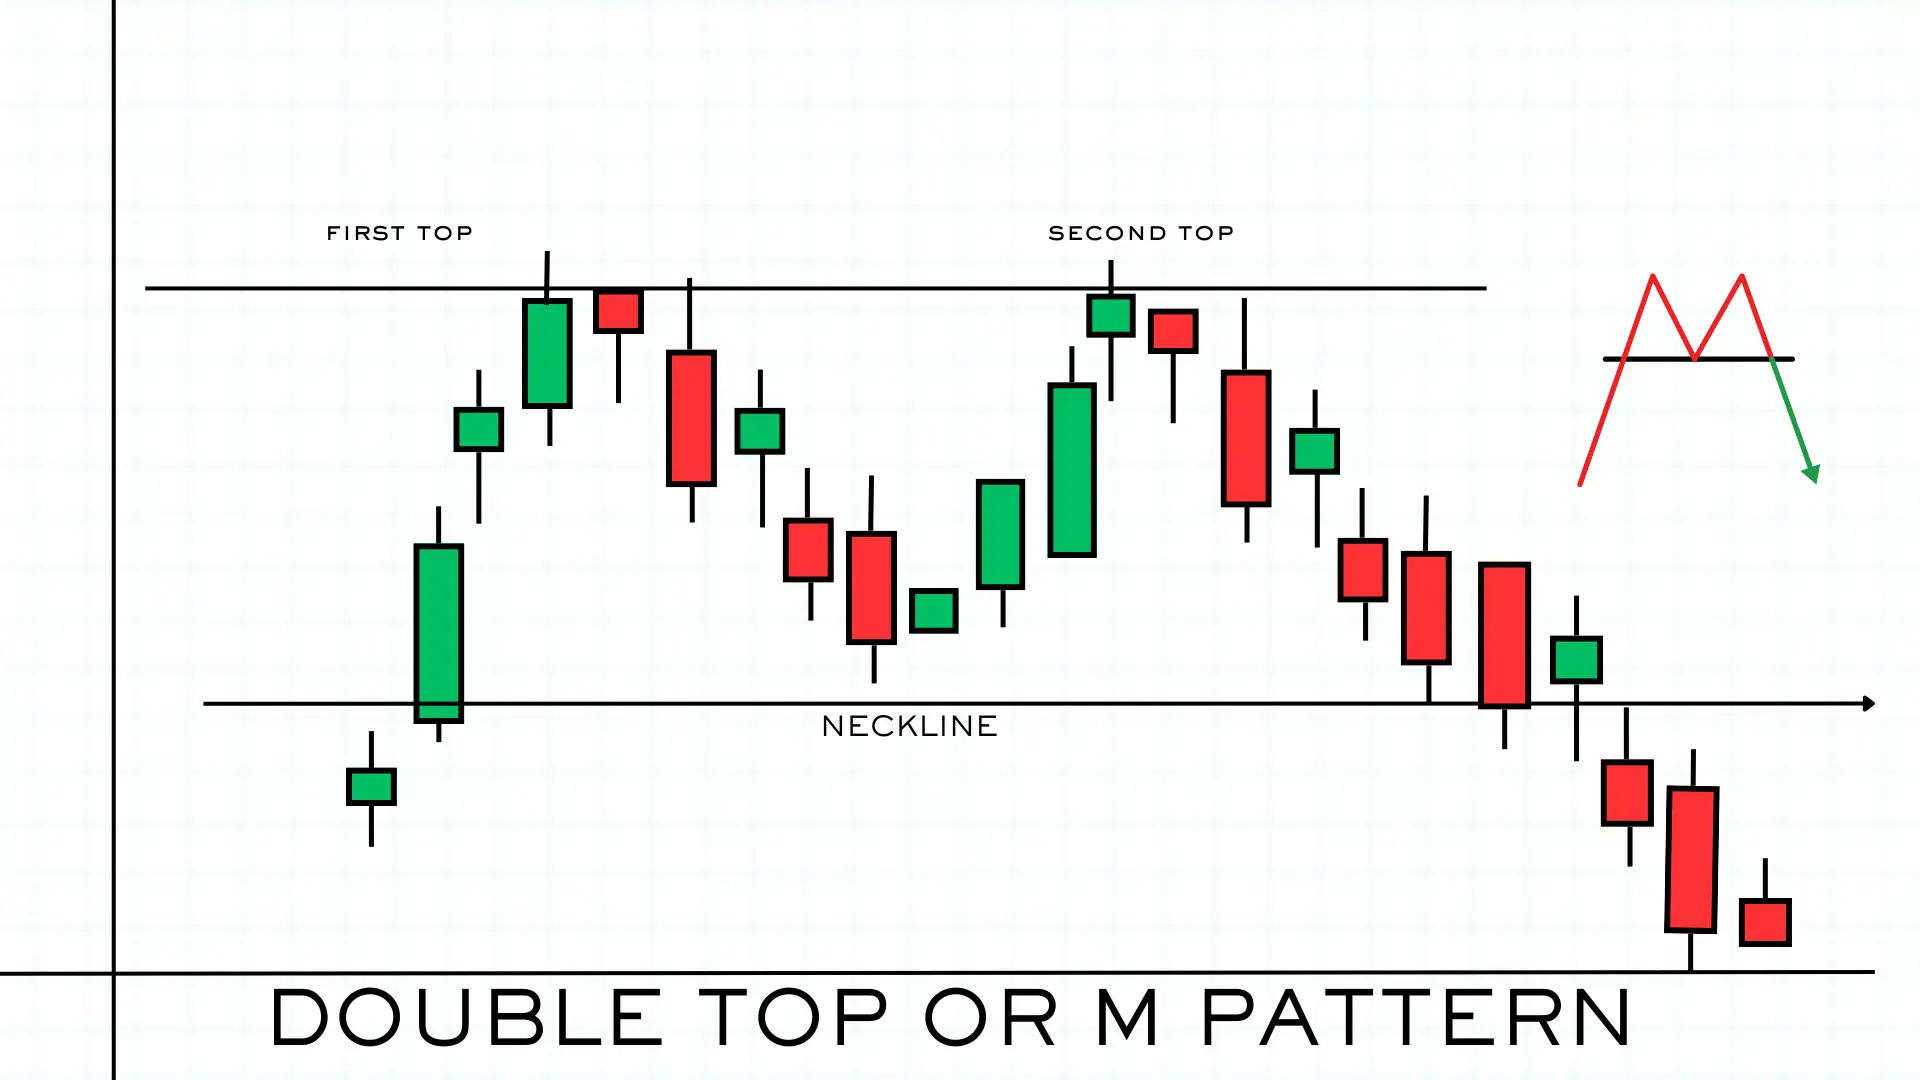
The double top or M pattern, which is a bearish reversal pattern, looks somewhat like the English letter M . The M pattern is most commonly used in intraday trading. The accuracy of the M pattern is around 70 to 75% where the stock or index is unable to move up once the M pattern is formed. Due to this, a decline is seen.
So let's understand how to work the M pattern.
In a double-top pattern, the stock comes back from resistance after moving up once, moves up from below a second time, then moves back down below the previous resistance level. But this time it is not able to stop at the support at the lower level, due to which a huge fall is seen due to breakdown on the lower side.
The double top pattern is shown in the chart above, In the chart you can see, that the stock once moved up, faced resistance, and came back down from the support level to above the previous resistance level. Again came down after facing resistance from the same level, but could not hold on to the support and after giving a support level breakdown, a decline was seen.
What should be the target and stop loss in double top or M pattern?
As soon as the double top pattern comes back from resistance and breaks the support level, we will go there to sell the stock or index below the M pattern formation. Where our stop loss will be the first and second resistance levels or high of M pattern and the target should be double the stop loss. So in this way, we can earn a big profit with small risk.
Click here for a Demat Account Opening in Zerodha (Investing and mutual fund free, F&O Per order Rs 20)


