
Analyzing the NSE option chain effectively can provide valuable insights for trading decisions in options markets. The option chain offers comprehensive data, including strike prices, open interest (OI), volume, premiums, and market sentiment.
1. Understanding the Option Chain Structure
An option chain, also known as an option matrix, lists all available call and put options for a particular underlying security in a tabular format. Key columns include:
- Strike Price: The agreed price for exercising the option.
- Call Options: Data for buy contracts (typically on the left half).
- Put Options: Data for sell contracts (typically on the right half).
- Open Interest (OI): The number of outstanding contracts for each strike price.
- Volume: The number of contracts traded in the session.
- Implied Volatility (IV): The expected future volatility of the underlying.
- Last Traded Price (LTP): The most recent transaction price of the contract.
2. Key Elements to Analyze
Open Interest (OI) and Change in OI
- High OI at a Strike: Indicates strong interest and possibly a support/resistance level.
Change in OI: Rising OI with price movement signals new money entering; falling OI can mean position closure.
1. Call Writers: High OI at a call strike may act as resistance.
2. Put Writers: High OI at a put strike may act as support.
- Volume
1. Volume vs. OI: High volume with rising OI supports the price trend.
2. Unusually High Volume: May signal increased interest and likely volatility at that strike price. - Implied Volatility (IV)
1. Rising IV: Indicates expectations of higher volatility; expensive options.
2. Low IV: Indicates a relatively calm market; cheaper options.
3. Steps to Analyze for Trading
Step 1: Identify At-the-Money (ATM), In-the-Money (ITM), and Out-of-the-Money (OTM) Strikes
- ATM: Strike price closest to the current underlying price.
- ITM: Calls below (and puts above) the current price.
- OTM: Calls above (and puts below) the current price.
Step 2: Assess Support and Resistance
- Find Strikes with Max OI on both call and put sides.
Max OI on calls = possible resistance.
Max OI on puts = possible support.
Step 3: Track Change in OI
- Rising OI + Price Rise (Calls): Bullish.
- Rising OI + Price Drop (Puts): Bearish.
- Use OI changes as a filter after studying price direction.
Step 4: Evaluate Put-Call Ratio (PCR)
- PCR = Total Put OI / Total Call OI
PCR > 1: Bearish sentiment.
PCR < 1: Bullish sentiment.
Step 5: Watch for Unwinding/Short Covering
- Call Unwinding (OI drops on calls): Indicates call writers are exiting, can be bullish.
- Put Writing (OI builds on puts): Indicates confidence in price floor/support.
4. Trading Strategies Using Option Chain
Market View | Option Strategy | Indicator in Option Chain |
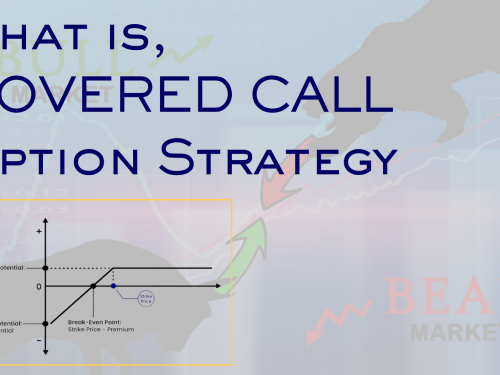
Bullish | Bull Call Spread, Long Call | Low PCR, OI buildup at put strikes |
Bearish | Bear Put Spread, Long Put | High PCR, OI buildup at call strikes |
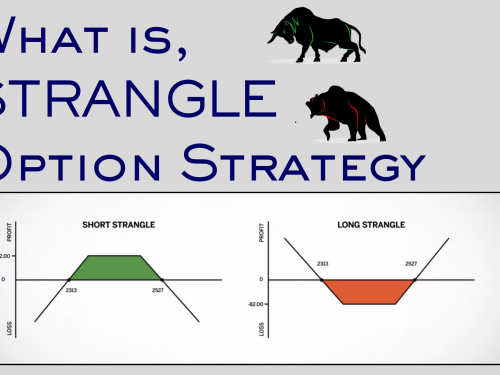
Volatility Expected | Straddle, Strangle | High IV and volumes near ATM |
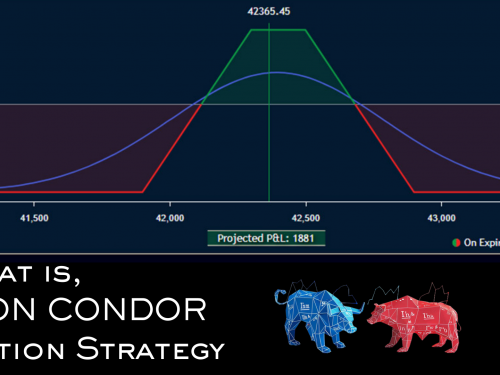
Neutral | Iron Condor, Short Straddle | Low IV, balanced OI on both sides |
5. Tips for NSE Option Chain Analysis
- Always confirm option chain insights with price action and broader market trends.
- Watch out for expiry effects: OI can quickly change as contracts approach expiry.
- Prefer strikes with high liquidity to avoid slippages.
6. Live Data and Tools
- NSE India’s official site offers real-time option chain data for all F&O stocks and indices.
- Tools like Nifty Trader and Sensibull provide analysis overlays with OI, PCR, and IV.
- An option chain is a rich source for market sentiment and trading signals. By focusing on open interest, volume, IV, and
- changes across strikes, traders can make well-informed decisions and choose optimal options strategies tailored to market conditions.


