SUPPORT OR DEMAND ZONE
Support levels are levels where a declining stock will find the bottom and bounce up. Supports are formed when a stock breaks above resistance and holds above that level: the old resistance then becomes support. Support levels are also formed when a stock spends a lot of time at one level and then breaks upward.
The support level is also called the Demand zone. The time frame may be changed to a 5-minute time frame for Intraday, a 15-minute and 1-hour time frame for a swing trade, and a 1-day time frame for short-term & long-term delivery.
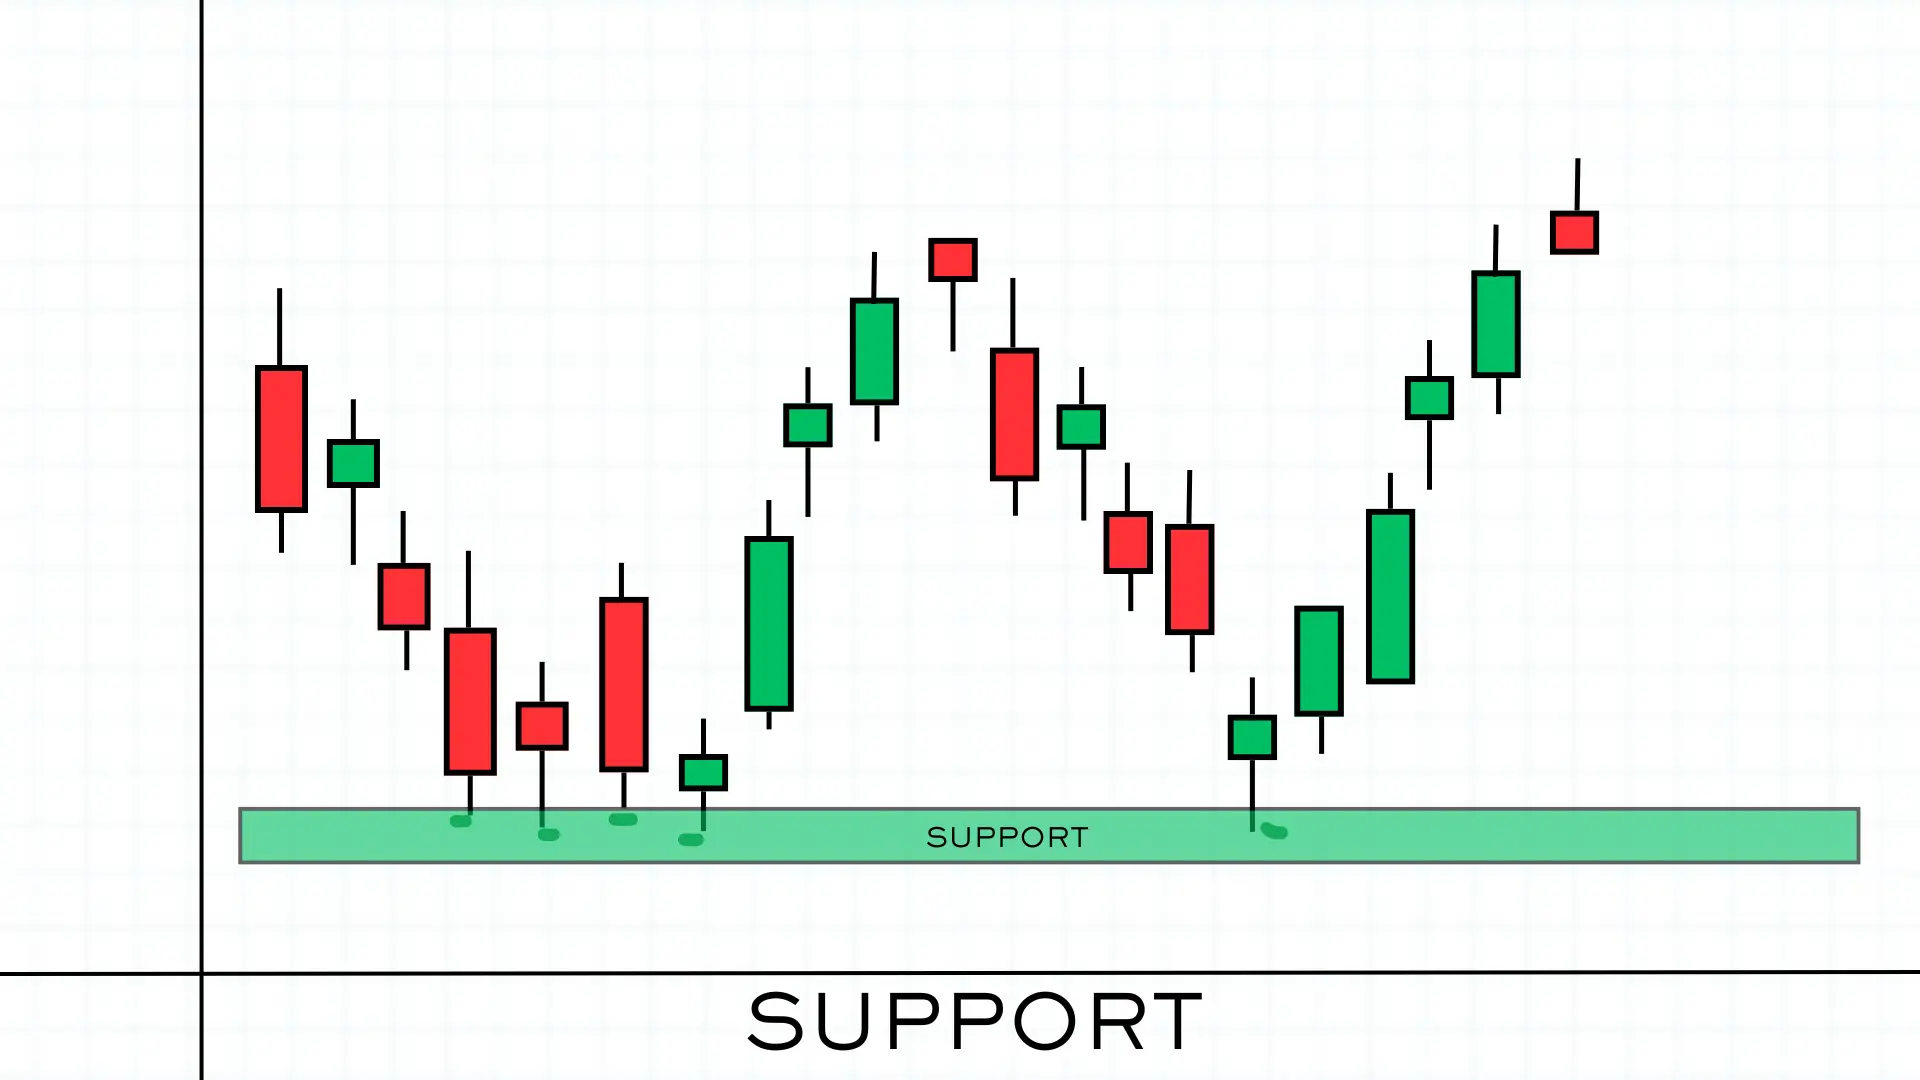
In the above chart, you can see the market was in a downtrend and a bullish engulfing pattern formed at the bottom level & bounced back. Again market fell from the resistance zone & took support at the previous support zone or demand zone and bounced back from the bottom level.
(Before reading the chart pattern, read the candlestick pattern once so that the chart pattern can be understood clearly)
What should be the stop loss and target in the support zone?
For better profit, you have to wait till the support level, if the market falls from the top level or resistance level to the bottom level or previous support or demand zone, a bullish candlestick should be formed for better confirmation. Once a bullish candlestick pattern is formed at a support level, you have to enter the above next candle (Entry price for a long position), and stop loss should be below the Support level. For target you can set the target of the previous high or resistance level in swing trading and Intraday you can take profit as per market condition.
RESISTANCE OR SUPPLY ZONE
Resistance is the level at which supply is strong enough to stop the stock from moving higher, due to which that stock is unable to go up, or when it reaches the resistance level, investors start selling, due to which the stock falls. And that stock is unable to cross the resistance level, which is called resistance zone.
You can see in this below chart.
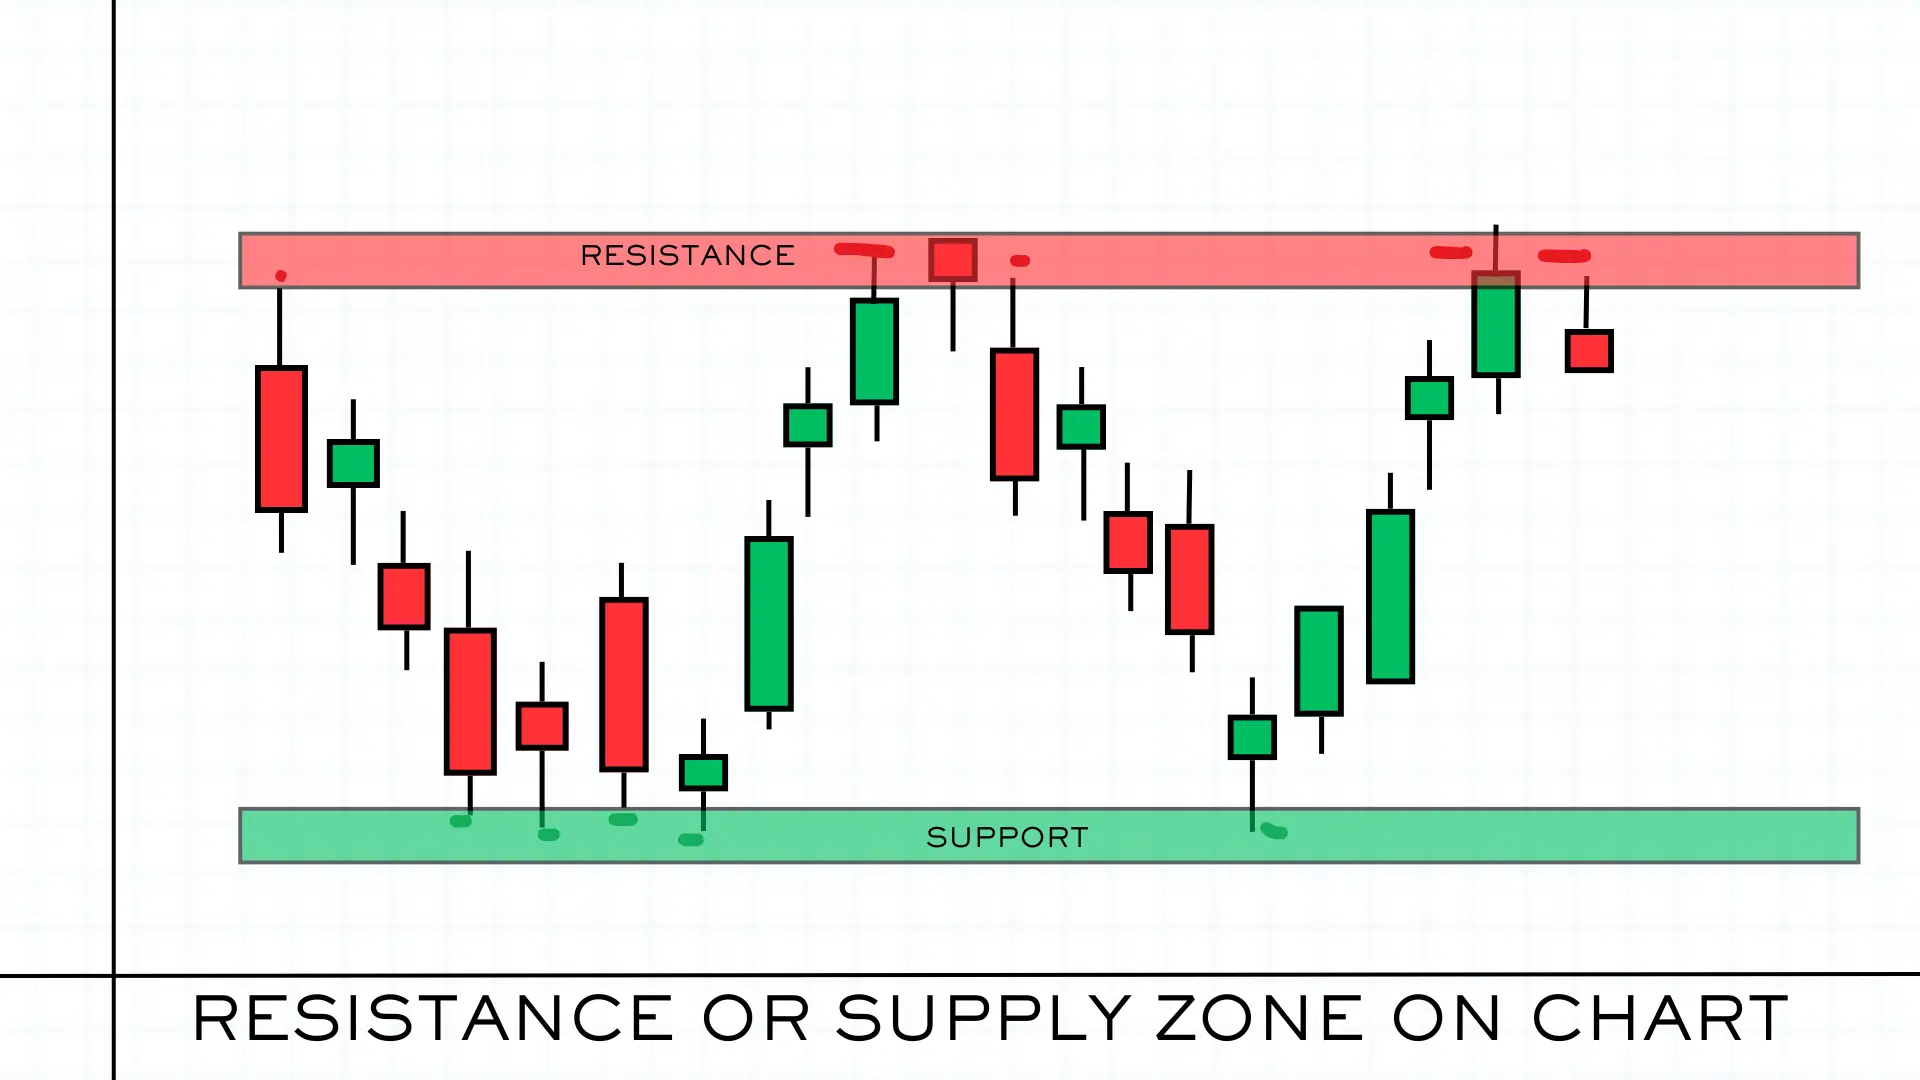
As soon as the stock reaches the resistance zone, the supply of that stock increases and selling starts in the stock, which is also called supply zone in the language of stock market. The resistance zone is always above the current market price (CMP) of the stock.
The support level is also called the Demand zone. The time frame may be changed to a 5-minute time frame for Intraday, a 15-minute and 1-hour time frame for swing trade & 1-Day time frame for short-term & long-term delivery.
In above chart, you can see market was a uptrend and shooting star candle formed at top level & Reversal for downtrend. Again market bounce back from the support zone and reached near resistance or supply zone and 2nd time also faced resistance. Unable to sustain at top level and same happed market fallen from the Resistance zone.
(Before reading the chart pattern, read the candlestick pattern once so that the chart pattern can be understood clearly)
What should be the target and stop loss in Resistance zone?
For entry level: Once bearish candlestick pattern formed at resistance level, you have to enter below next bearish candle (Entry price for short selling position) and Stoploss should be above the Resistance level. For target: you can set target previous low or support level for short term trading and in Intraday you can take profit as per market condition.

