-
Admin ''

- Feb 18, 2025
Long Put Option Trading Strategy is a very simple and very basic Strategy. Mostly we are using this strategy whenever Nifty or Bank Nifty is bearish in the market or any stock is bearish, then we can go for a big profit with small risk in the put option buying of that index or stock, just buy the put option. The position created in this way is called the long put option trading strategy.
-
Admin ''
- Feb 18, 2025
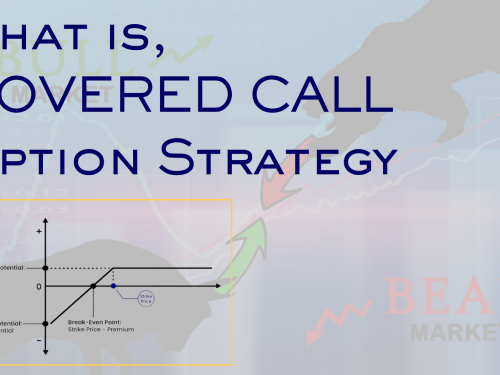
The “covered call option trading strategy” is a strategy used as a rental income, where a profit of 2 to 3% can be earned on every month. This strategy is used by people who buy a stock with a large amount and sell call options on that stock to trade the position safely. If the stock does not increase, then money is earned by selling its call option.
-
Admin ''
- Feb 18, 2025
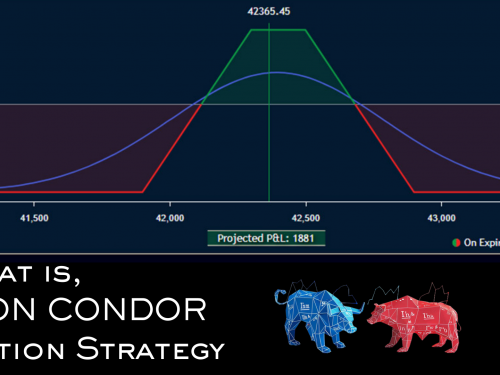
Iron Condor option trading Strategy, This strategy is used when the market is sideways, and neither a boom nor a recession is seen. This options trading strategy is a combination of “Short Straddle” and “Long Strangle”, which is a very safe options trading strategy. The profit is high, while the loss incurred is very low.
-
Admin ''
- Feb 18, 2025
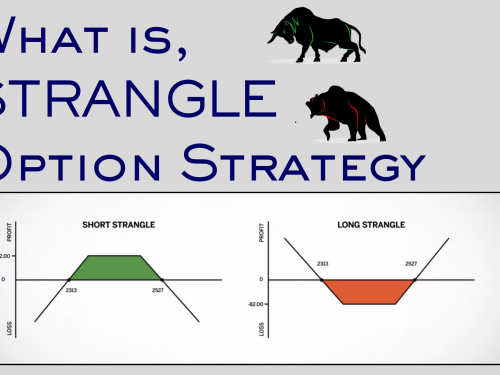
Strangle strategy is an option trading strategy, where you buy both a call option and a put option with the same expiration date but a different strike price. The main importance of both options is that both options are “Out the money” when you buy or sell both options.
-
Admin ''
- Feb 18, 2025
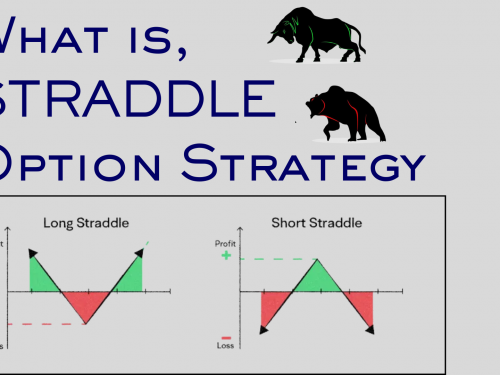
A straddle option strategy involves buying both a call option and a put option with the same strike price and expiration date. It's like betting on both sides of a coin toss – you're not sure which way the market will move, but you're hoping for a big move in any direction.
-
Admin ''
- Feb 18, 2025
A long call butterfly is an options trading strategy that involves three different call options with the same expiration date but different strike prices. Here's how it works.
-
Admin ''
- Feb 18, 2025
Futures are a type of derivative contract agreement to buy or sell a specific Stock, Index, commodity asset, or security at a set future date for a set price. Futures contracts, or simply "futures," are traded on futures exchanges like the NSE, BSE, and MCX and require a trading account that’s approved to trade futures.
-
Admin ''
- Feb 18, 2025
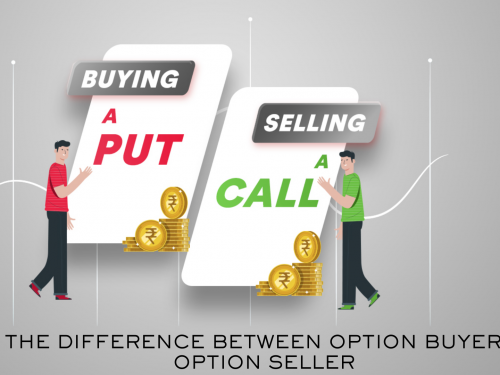
The difference between Option buyer & option seller, Buyer of an option has limited risk (to the extent premium paid), An Option writer has unlimited risk, An option buyer has a high reward-to-risk ratio, Option writer has a low reward-to-risk ratio, An option buyer has unlimited profit potential, Option writer has to pay margin money (exposure and span margin),
-
Admin ''
- Feb 18, 2025
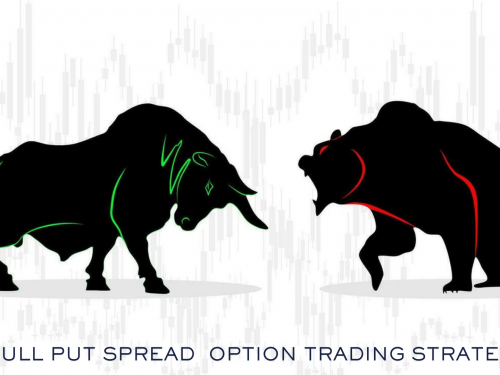
Bull put spread, As the name suggests, Bull means the market is bullish and Put spread that is, has been created by combining put options. In this strategy “At the money” or “In the money” Put option, we have to sell & “Out the money” put option, we have to buy.
-
Admin ''
- Feb 18, 2025
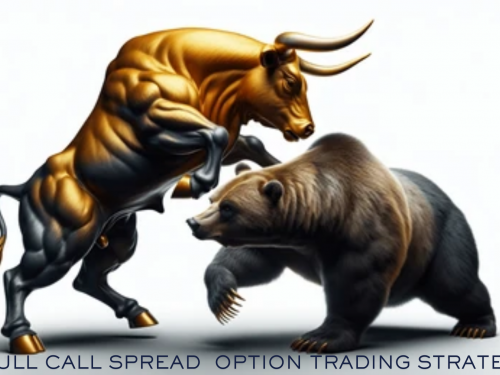
Bull Call Spread as the name suggests, is made by combining, Bull i.e., the market is bullish and Call Spread is made by combining two call options, in which the “In the money” call option or “At the money” call option is bought and the “Out the money” call option is sold. Which is called “Bull call spread”
-
Admin ''
- Feb 18, 2025
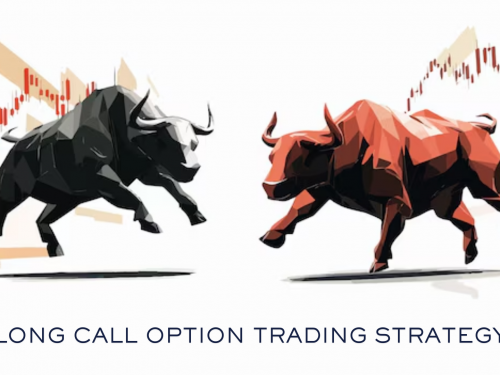
Long Call Option Trading Strategy is a very simple and very basic strategy that is the most used. whenever a trader, If the Nifty or Bank Nifty index is bullish in the market or any stock is bullish, then take call option of that index or call option of that stock for big profits by taking a small risk. The position created in this way is called LONG CALL.
-
Admin ''
- Feb 18, 2025
The call option provides buying rights to the buyer, but without any obligation of buying, Put option provides selling rights to the buyer without any obligation to sell, Call option buyers expect that the stock or index prices will increase, Put option buyer is determined that the stock or index prices will decrease