
-
Admin ''

- Feb 20, 2025
There are many ways to start investing, and the best approach for you will depend on your financial goals, risk tolerance, and other factors. Here are some steps you can take to start investing: Determine your financial goals: What do you want to achieve through investing? Do you want to save for retirement, generate income, or grow your wealth over the long term?
-
Admin ''
- Feb 20, 2025
There are several general rules that can help guide your investment decisions: Start early: The earlier you start investing, the more time you have for your money to grow through compound interest. This can be especially beneficial if you’re saving for long-term goals like retirement.

-
Admin ''
- Feb 20, 2025
Ownership investments, also known as equity investments, involve buying a stake in a company. This can be in stocks, mutual funds, or exchange-traded funds (ETFs). As an owner, you have the potential to earn profits through dividends or by selling your stake in the company for a higher price. However, ownership investments also carry risk, as the company's and your investment's value can
-
Admin ''
- Feb 20, 2025
अगर आप ऑप्शन ट्रेडिंग करते हैं, तो ऑप्शन ट्रेडिंग करने से पहले ऑप्शन ग्रीक्स के बारे में जानना बहुत जरूरी है, क्योंकि ऑप्शन ग्रीक्स के चार फैक्टर होते हैं, जो कि ऑप्शन में होने वाले बदलाव को आसानी से बताते हैं। जिसकी सहायता से ऑप्शन ट्रेडिंग करने में आसानी हो जाती है और हम किसी भी ऑप्शन को खरीदने के लिए और सही टाइम में बेचने के लिए मदद मिलती है।
-
Admin ''
- Feb 20, 2025
शेयर बाजार में कई तरह के शब्दों या टर्म्स का इस्तेमाल होता है। अगर आप एक निवेशक है, तो ट्रेडिंग के दौरान इन शब्दों जैसे फेस वैल्यू (FACE VALUE),स्टॉक स्प्लिट (STOCK SPLIT), डिविडेंड (DIVIDEND), शेयर बायबैक (SHARE BUYBACK), शब्द अक्सर सुनने को मिलते हैं, हाल ही में फाइनेंस की बड़ी लिस्टेड कंपनी BAJAJFINSV ने अपने स्टॉक स्प्लिट का ऐलान किया था।
-
Admin ''
- Feb 18, 2025
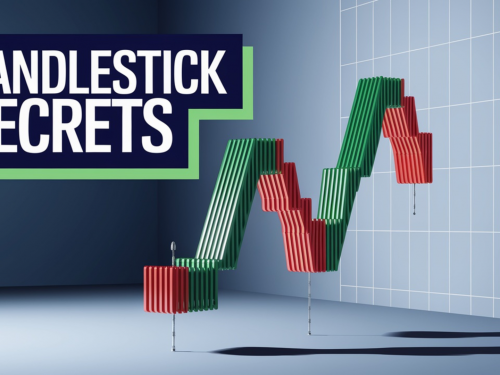
All 12 Candlestick Chart Patterns in the Stock Market Table of Contents सपोर्ट (SUPPORT) रेजिस्टेंस (RESISTANCE) अपट्रेंड और डाउनट्रेंड (UPTREND & DOWNTREND) अपट्रेंड (UPTREND) डाउनट्रेंड (DOWNTREND) बेयरिश फ्लैग पैटर्न (BEARISH FLAG PATTERN) बुलिश एनगल्फिंग पैटर्न (BULLISH ENGULFING PATTERN) बुलिश फ्लैग पैटर्न (BULLISH FLAG PATTERN) बेयरिश फ्लैग पैटर्न (BEARISH FLAG PATTERN)

-
Admin ''
- Feb 18, 2025
How to earn money from the Market शेयर मार्केट से दो तरह से मुनाफा कमाया जा सकता हैं। 1 शेयर मार्केट से ट्रेडिंग करके मुनाफा कमाया जा सकता हैं। 2 शेयर मार्केट में इन्वेस्टमेंट करके मुनाफा कमाया जा सकता हैं।

-
Admin ''
- Feb 18, 2025
किसी भी शेयर की मांग ज्यादा हो और उस शेयर की आपूर्ति हो, तो वहां पर शेयर की कीमत बढ़ने लगती है, उसी के विपरीत अगर शेयर की भरमार हो जाए और उसकी मांग ज्यादा ना हो तो वहां पर शेयर की कीमत में गिरावट आ जाती हैं। यह ठीक उसी प्रकार से काम करता है, जैसा कि सब्जी मंडी में सब्जी के मांग और आपूर्ति होने पर उसकी कीमत बढ़ती और घटती हैं।
-
Admin ''
- Feb 18, 2025
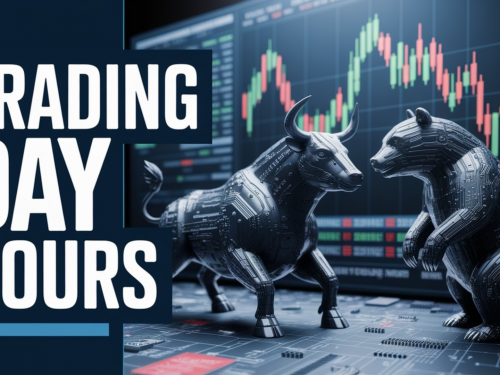
शेयर मार्केट पूरी तरह से ओपन होने के पहले Pre-Open होता हैं, जहां पर हम शेयर को खरीदने या हमारे पास होल्डिंग में पहले से हैं, तो उसे बेचने के लिए आर्डर लगा सकते हैं। जिस का निर्धारित समय सुबह 9:00 बजे से 9:08 तक होता हैं, उसके बाद 9:08 से 9:15 के बीच में ऑर्डर एग्जीक्यूशन का टाइम होता हैं, जहां पर अगर किसी ने ऑर्डर खरीदने के लिए या ऑर्डर के लिए लगाया हैं
-
Admin ''
- Feb 18, 2025
All candlestick pattern for intraday trading which is used in intraday trading. BULLISH CANDLESTICK PATTERN, BEARISH CANDLESTICK PATTERN, BULLISH CHART PATTERN, BEARISH CHART PATTERN.
-
Admin ''
- Feb 18, 2025
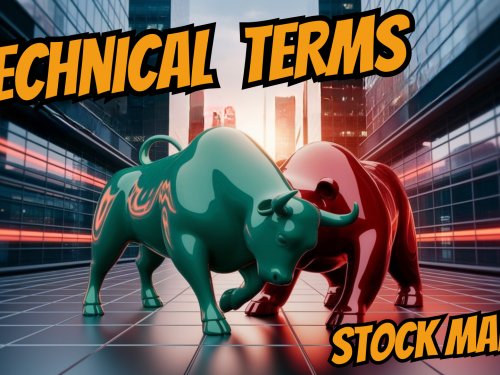
Technical terms, which is used in stock market in hindi BULL MARKET, BEAR MARKET, UPTREND OR BULLISH MARKET, DOWNTREND OR BEARISH MARKET, RANGE BOUND OR SIDEWAYS, TREND, LONG POSITION, SHORT POSITION, HIGH & 52 WEEK HIGH, LOW & 52 WEEK LOW, ALL TIME HIGH, ALL TIME LOW, UPPER CIRCUIT & LOWER CIRCUIT, OPENING PRICE, CLOSING PRICE, PREVIOUS CLOSING, INTRADAY TRADING,
-
Admin ''
- Feb 18, 2025
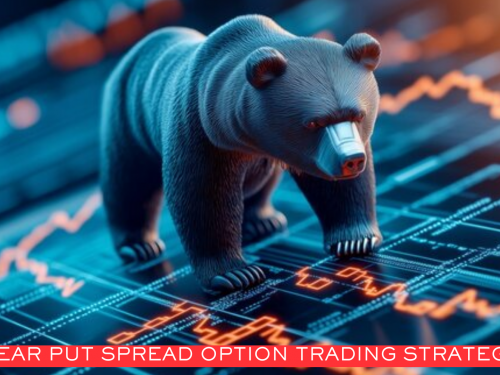
“Bear put spread”, as the name suggests, bear means the bearish environment in the Share market, and put spread meaning, it has been created by combining two put options. Whenever there is a bearish situation in the market, “in the money” or “at the money” put option is purchased and “out the money” option is sold. The position created in this way is called a “Bear put spread” Option strategy.