-
Admin ''

- Mar 02, 2025
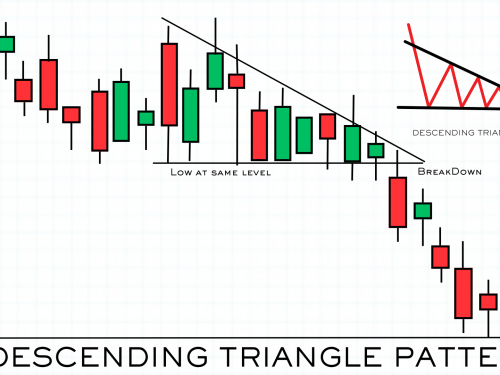
The descending triangle pattern is a bearish chart pattern. It is the opposite of the ascending triangle pattern. In this, the swing lows are at or about the same level whereas there are consistently lower highs. It forms when sellers are getting stronger and buyers are weak. You can take advantage of price fall when the swing lows are broken.

-
Admin ''
- Mar 02, 2025
The double top or M pattern, which is a bearish reversal pattern, looks somewhat like the English letter M. The M pattern is most commonly used in intraday trading. The accuracy of the M pattern is around 70 to 75% where the stock or index is unable to move up once the M pattern is formed. Due to this, a decline is seen.
-
Admin ''
- Mar 02, 2025
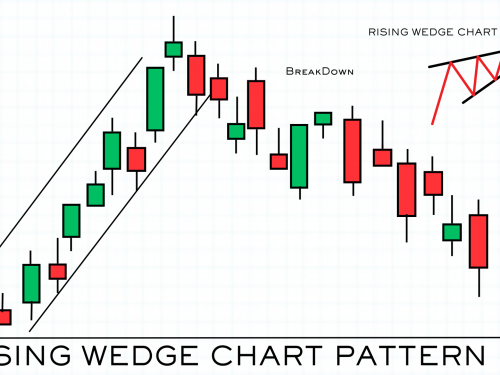
The rising wedge pattern is a bearish chart pattern that signals an imminent breakout to the downside. It’s the opposite of the falling wedge pattern, as these two constitute a popular wedge pattern. A rising wedge can be both a continuation and reversal pattern, although the former is more common and more efficient as it follows the direction of an overall trend.
-
Admin ''
- Feb 17, 2025
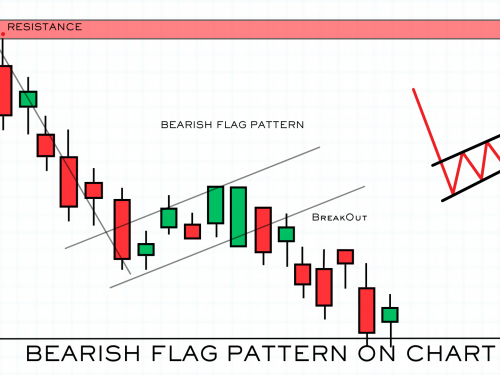
A flag is a chart pattern formed during a counter-trend down after a sharp fall in price movement. A bear flag pattern forms during a downtrend. It got its name because it resembles a flag on a flagpole while the price continues to move in a downtrend, attaining lower lows and lower highs.
-
Admin ''
- Feb 17, 2025
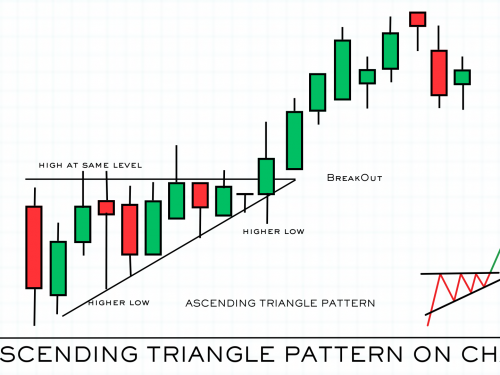
The ascending triangle pattern is the bullish chart pattern. In this, all the swing highs will be at the same level and each low will be higher than the previous low. With each candle, the price keeps shifting higher but stays under the resistance zone.
-
Admin ''
- Feb 17, 2025
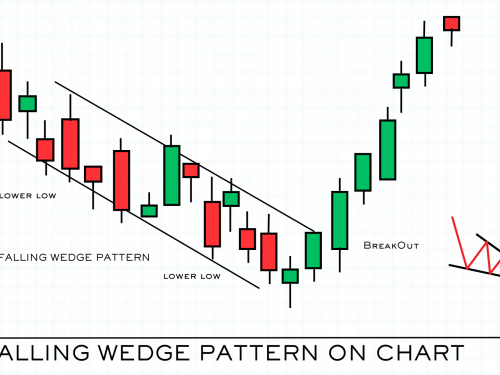
The falling wedge is a bullish pattern. Together with the rising wedge formation, these two create a powerful pattern that signals a change in the trend direction. In general, a falling wedge pattern is considered to be a reversal pattern, although there are examples when it facilitates a continuation of the same trend.
-
Admin ''
- Feb 17, 2025
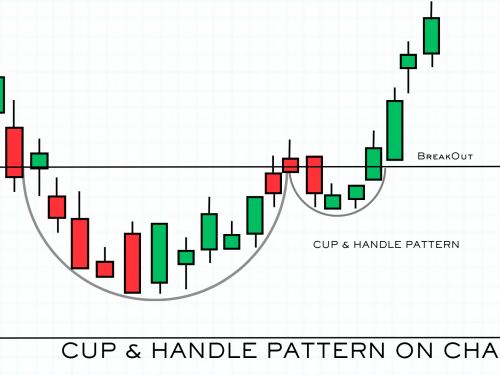
This is a bullish pattern. The cup and handle pattern imply that the sellers have taken the price lower but buyers absorbed all the selling and took the price again to the level from where it had started falling.
-
Admin ''
- Feb 17, 2025
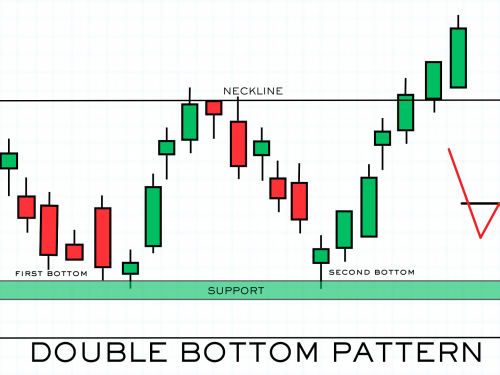
Double bottom pattern, which is a bullish reversal pattern, which looks somewhat like the English letter W. The double bottom pattern is most commonly used in intraday trading and swing trading. The accuracy of the W pattern is around 70 to 75%, where once the stock or index forms the W pattern, it becomes easier to move up. Due to which bullish trend or rise is seen in the stock.
-
Admin ''
- Feb 17, 2025
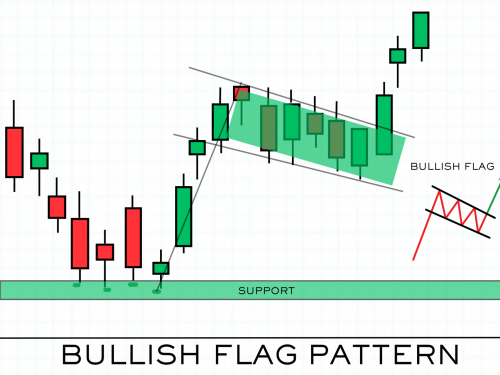
A flag is a chart pattern formed during a counter-trend move after a sharp price movement. A bull flag pattern forms during an uptrend. It got its name because it resembles a flag on a flagpole while the price continues to move in an uptrend, attaining higher highs and higher lows.
-
Admin ''
- Feb 17, 2025
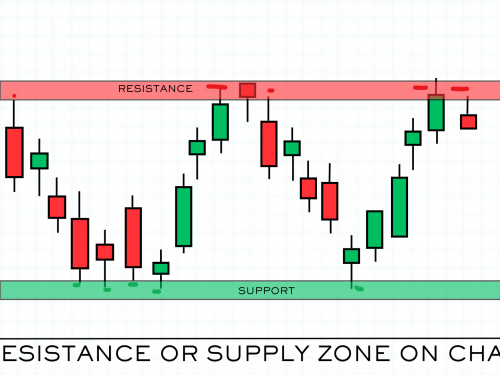
Support levels are levels where a declining stock will find the bottom and bounce up. Support levels are also formed when a stock spends a lot of time at one level and then breaks upward. Resistance is the level at which supply is strong enough to stop the stock from moving higher, due to which that stock is unable to go up, or when it reaches the resistance level, investors start selling.
-
Admin ''
- Feb 17, 2025
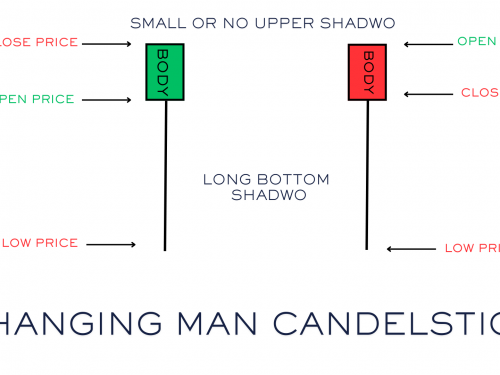
Hanging Man Candle looks similar to hammer Candle. In hanging man candles, opening, closing, and high price are almost the same. Hanging Man Candle has 75-85% lower shadow and 25-15% real body. The hanging man candle is characterized by having a small real body, little or no upper shadow (wick), and a lower shadow at least twice the length of the body.
-
Admin ''
- Feb 17, 2025
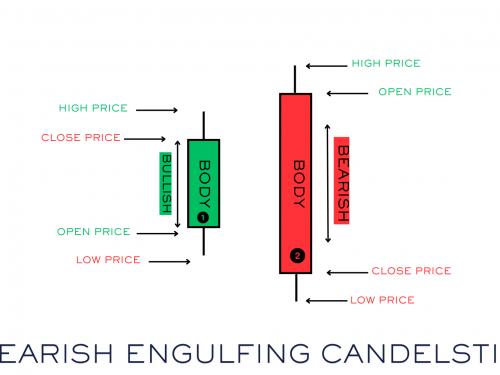
The bearish engulfing pattern is a strong bearish reversal candlestick pattern for intraday in an uptrend market near the resistance zone or supply zone. We can follow a bearish engulfing pattern like a shooting star candle.